Page History
...
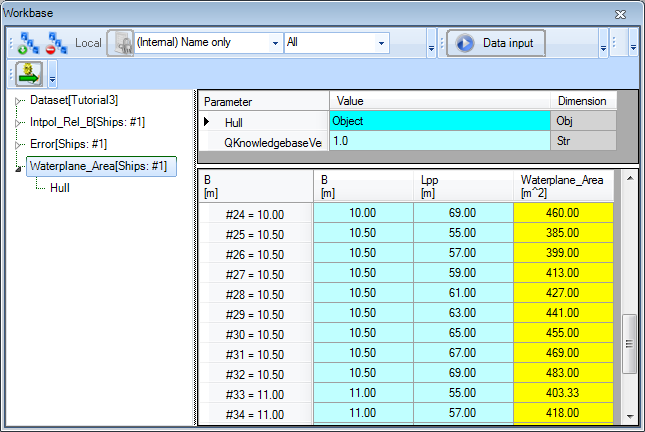
The waterplane area is calculated for every variation in length and breadth of the ship.
- In the
Waterplane_Areasolution tree, select the objectHull.
Because we solved a multiple case problem, the object has been used as function and reused for every case. Only the contents of the last case calculated remains in the object. The columns X and B3_Frame are added to the object, whose values are calculated for every case of Frame and Rel_B within Hull.
5 Calculating the stability
...
The dimensions of all new parameters must be meters (m), and they are SYS parameters. Their relations follow. GM is a Top Goal and should be moved to Top Goals/Undefined.
- In the class
Stability, enter the following relations.
Distance between keel K and center of buoyancy B, select KB , right-click and select New Relation... (or press Ctrl+N). By selecting KB it is automatically presented as left side part of the relation:
KB = 0.7 * T
Distance between keel K and center of gravity G, KG, in meters:
KG = 0.8 * T
Distance between center of buoyancy B and metacenter M, BM, in meters:
BM = Moment_of_Inertia / (DISP * 1000/ Rho)
Third power of the width at a specified frame number in m^3:
B3_Frame = B_Frame^3
Moment of inertia of the waterplane area in m^4:
Moment_of_Inertia = 1/12 * INTEGR(Hull(@X, @B3_Frame, Lpp, B), 2, @X, @B3_Frame, 2, 0, Lpp)
Third power of the width at a specified frame number in m^3:
B3_Frame = B_Frame^3
Note that the syntax of the moment of inertia relation is similar to that of the waterplane area relation.
Do not forget to provide all dimensions and references, and change the Determined by fields to SYS: System/equationNote that the syntax of the moment of inertia relation is similar to that of the waterplane area relation.
- Add
@RANGEALLOWEDto parameterDISP(Parameter tab, Data field of Properties window). - Run a solution for the initial stability
GMof every possible ship, by selecting theShipsobject andGMas task in the Process Manager. Press Next repeatedly until the text on the button turns to Data input again and the solution is completed. - In the
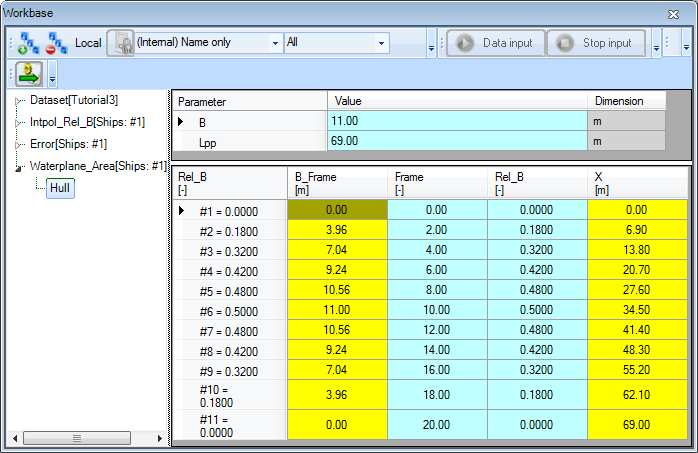
GMsolution tree, select the objectHull.
If the object Hull in the solution is now opened again, you'll see that, like for the waterplane area, the columns X and B3_frame Frame are added to the object, whose values are calculated for every case of Frame and Rel_B within Hull. Note that the parameter B_Frame is also added, as it is used to calculate B3_Frame. See figure 4. Again, only the values of the last ship (last input case) are stored in the object.

Figure 4 Object Hull with added parameters
6 Comparing the stability to other ships
Finaly, we'd like to compare the obtained values for GM to other ships. Data of the GM value for a certain ship length is available, so we only have to compare them. We'll use the least squares method to obtain an average GM value for a certain length, using the data of some other ships.
...
- Add the following new relation to your
Top Goals/Undefined:
GM_Check = LEASQ(TEXTITEM$(1), 2, "L", "GM", Lpp, 2)
GM_Check is in meters.
- Enter the following text in
...
- the Expression Data
...
- field in the Expression Editor of the relation
GM_Check:
...
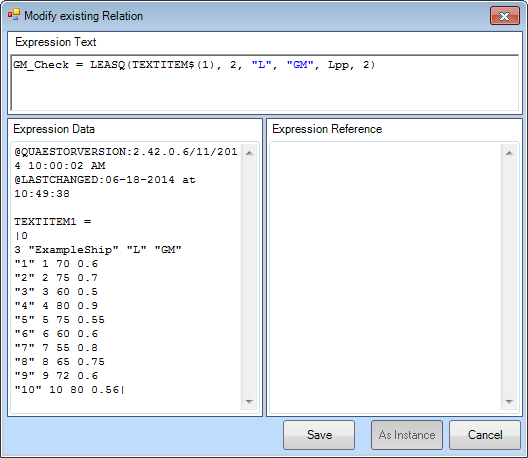
The LEASQ interpolation function now returns an average GM GM value in meters for a certain Lpp. The syntax TEXTITEM$(nr) is often used in Quaestor, and refers to a template, text item or TeLiTab in the Data slot of the Expression Editor. In this way, data that is not included in the knowledgebase but is only used in a particular function (as in our relation) can be used.
Note that the syntax of the relation uses TEXTITEM$(nr), but in the data slot the syntax TEXTITEM1= is used. The TeLiTab is written between two | characters. Multiple textitems can be available in a relation (TEXTITEM$(10, TEXTITEM$(2) .. TEXTITEM$(n)). Furthermore, please
| Note |
|---|
Please note that "the devil is in the detail". Small errors in your syntax will always be a |
...
problem for software such as Quaestor. Therefore, keep checking the correctness of your syntax. |
...
Figure 5 Including data in the relation by using textitems
...
- Run a solution using the Process Manager. Select
Waterplane_Area,GM
...
- and
GM_Checkas goals
...
- . Again, press Next until the solution is completed.
| Info |
|---|
You can select several goals at once! |
To browse through results, it might be convenient to maximize the workbase window. Remember that you can always return to the default lay-out using the menu sequence Window->Standard. The result of the last solution is shown in figure 6.

should look like this:
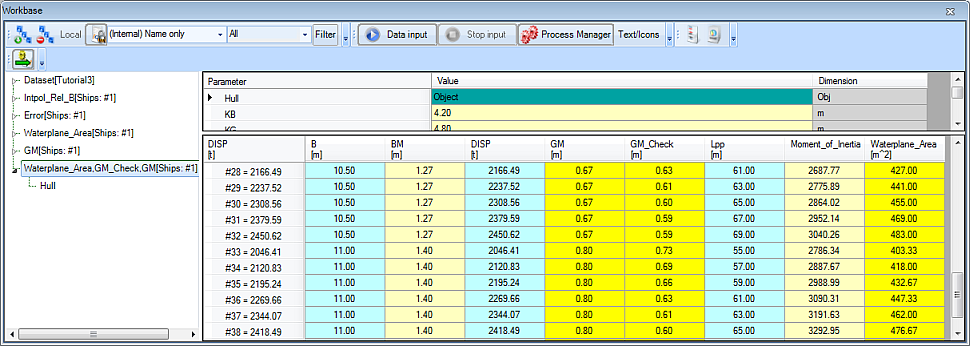 Figure 6 Output of the solution, if the workbase window is maximized an inspection of the results is more easy
7 Check
You can verify your results by comparing it to [Tutorial 3 Finished]
Overview
Content Tools