Page History
...
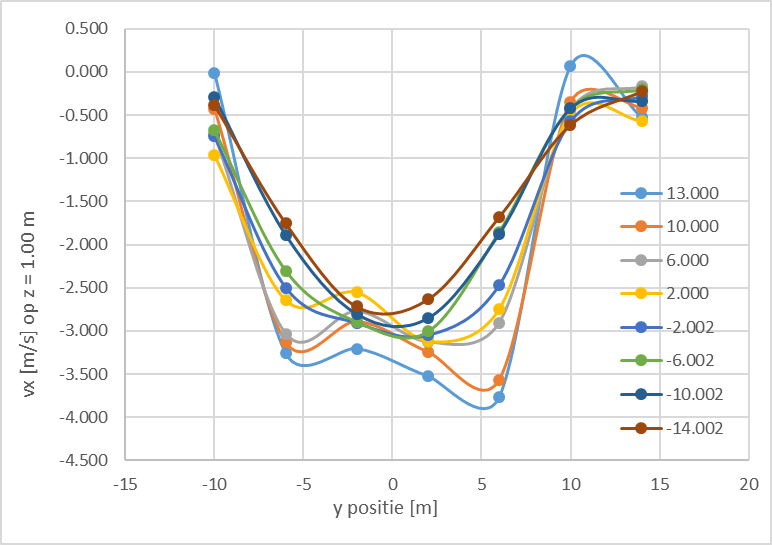
- Longitudinal range (27m): -14m<x<13m
- Lateral range (24m): -10m<y<14m
In the figure below measured longitudinal velocities at 1.00m are presented. Each line represents a constant x-coordinate for multiple measurements of different y-coordinates. For this figure you can observe, that the velocity drops significantly towards the edges in lateral direction. Good sailing conditions are mainly in the range of -5m to 5m in lateral direction. The deviation in longitudinal direction is present, but less pronounced.
Overview
Content Tools